# Generate efficient frontier
target_returns = np.linspace(mean_returns.min(), mean_returns.max(), 50)
efficient_portfolios = []
for target in target_returns:
# Constraint tambahan untuk target return
constraints_ef = [
{'type': 'eq', 'fun': lambda x: np.sum(x) - 1},
{'type': 'eq', 'fun': lambda x: portfolio_return(x, mean_returns) - target}
]
result = minimize(
fun=lambda w: portfolio_variance(w, cov_matrix),
x0=initial_weights,
method='SLSQP',
bounds=bounds,
constraints=constraints_ef
)
if result.success:
efficient_portfolios.append({
'return': target,
'std': portfolio_std(result.x, cov_matrix),
'weights': result.x
})
# Extract data untuk plotting
ef_returns = [p['return'] for p in efficient_portfolios]
ef_stds = [p['std'] for p in efficient_portfolios]
# Generate random portfolios untuk comparison
n_random = 5000
random_portfolios = []
for _ in range(n_random):
w = np.random.random(n_assets)
w /= np.sum(w)
random_portfolios.append({
'return': portfolio_return(w, mean_returns),
'std': portfolio_std(w, cov_matrix)
})
random_returns = [p['return'] for p in random_portfolios]
random_stds = [p['std'] for p in random_portfolios]
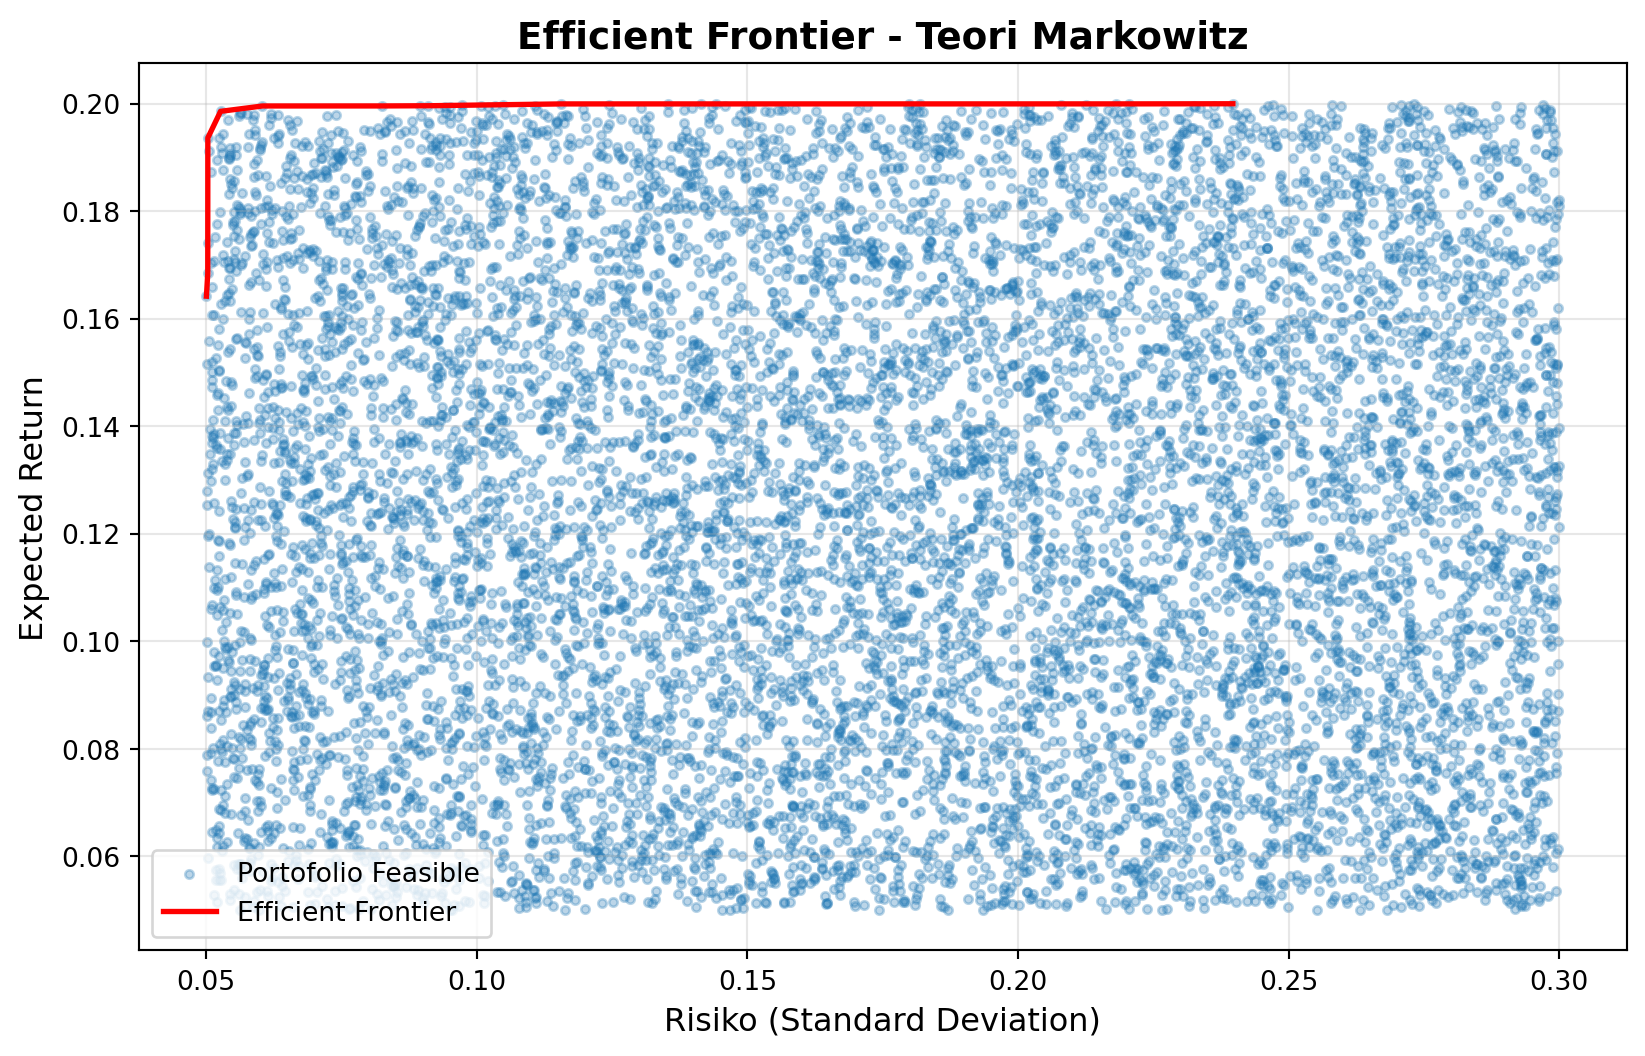
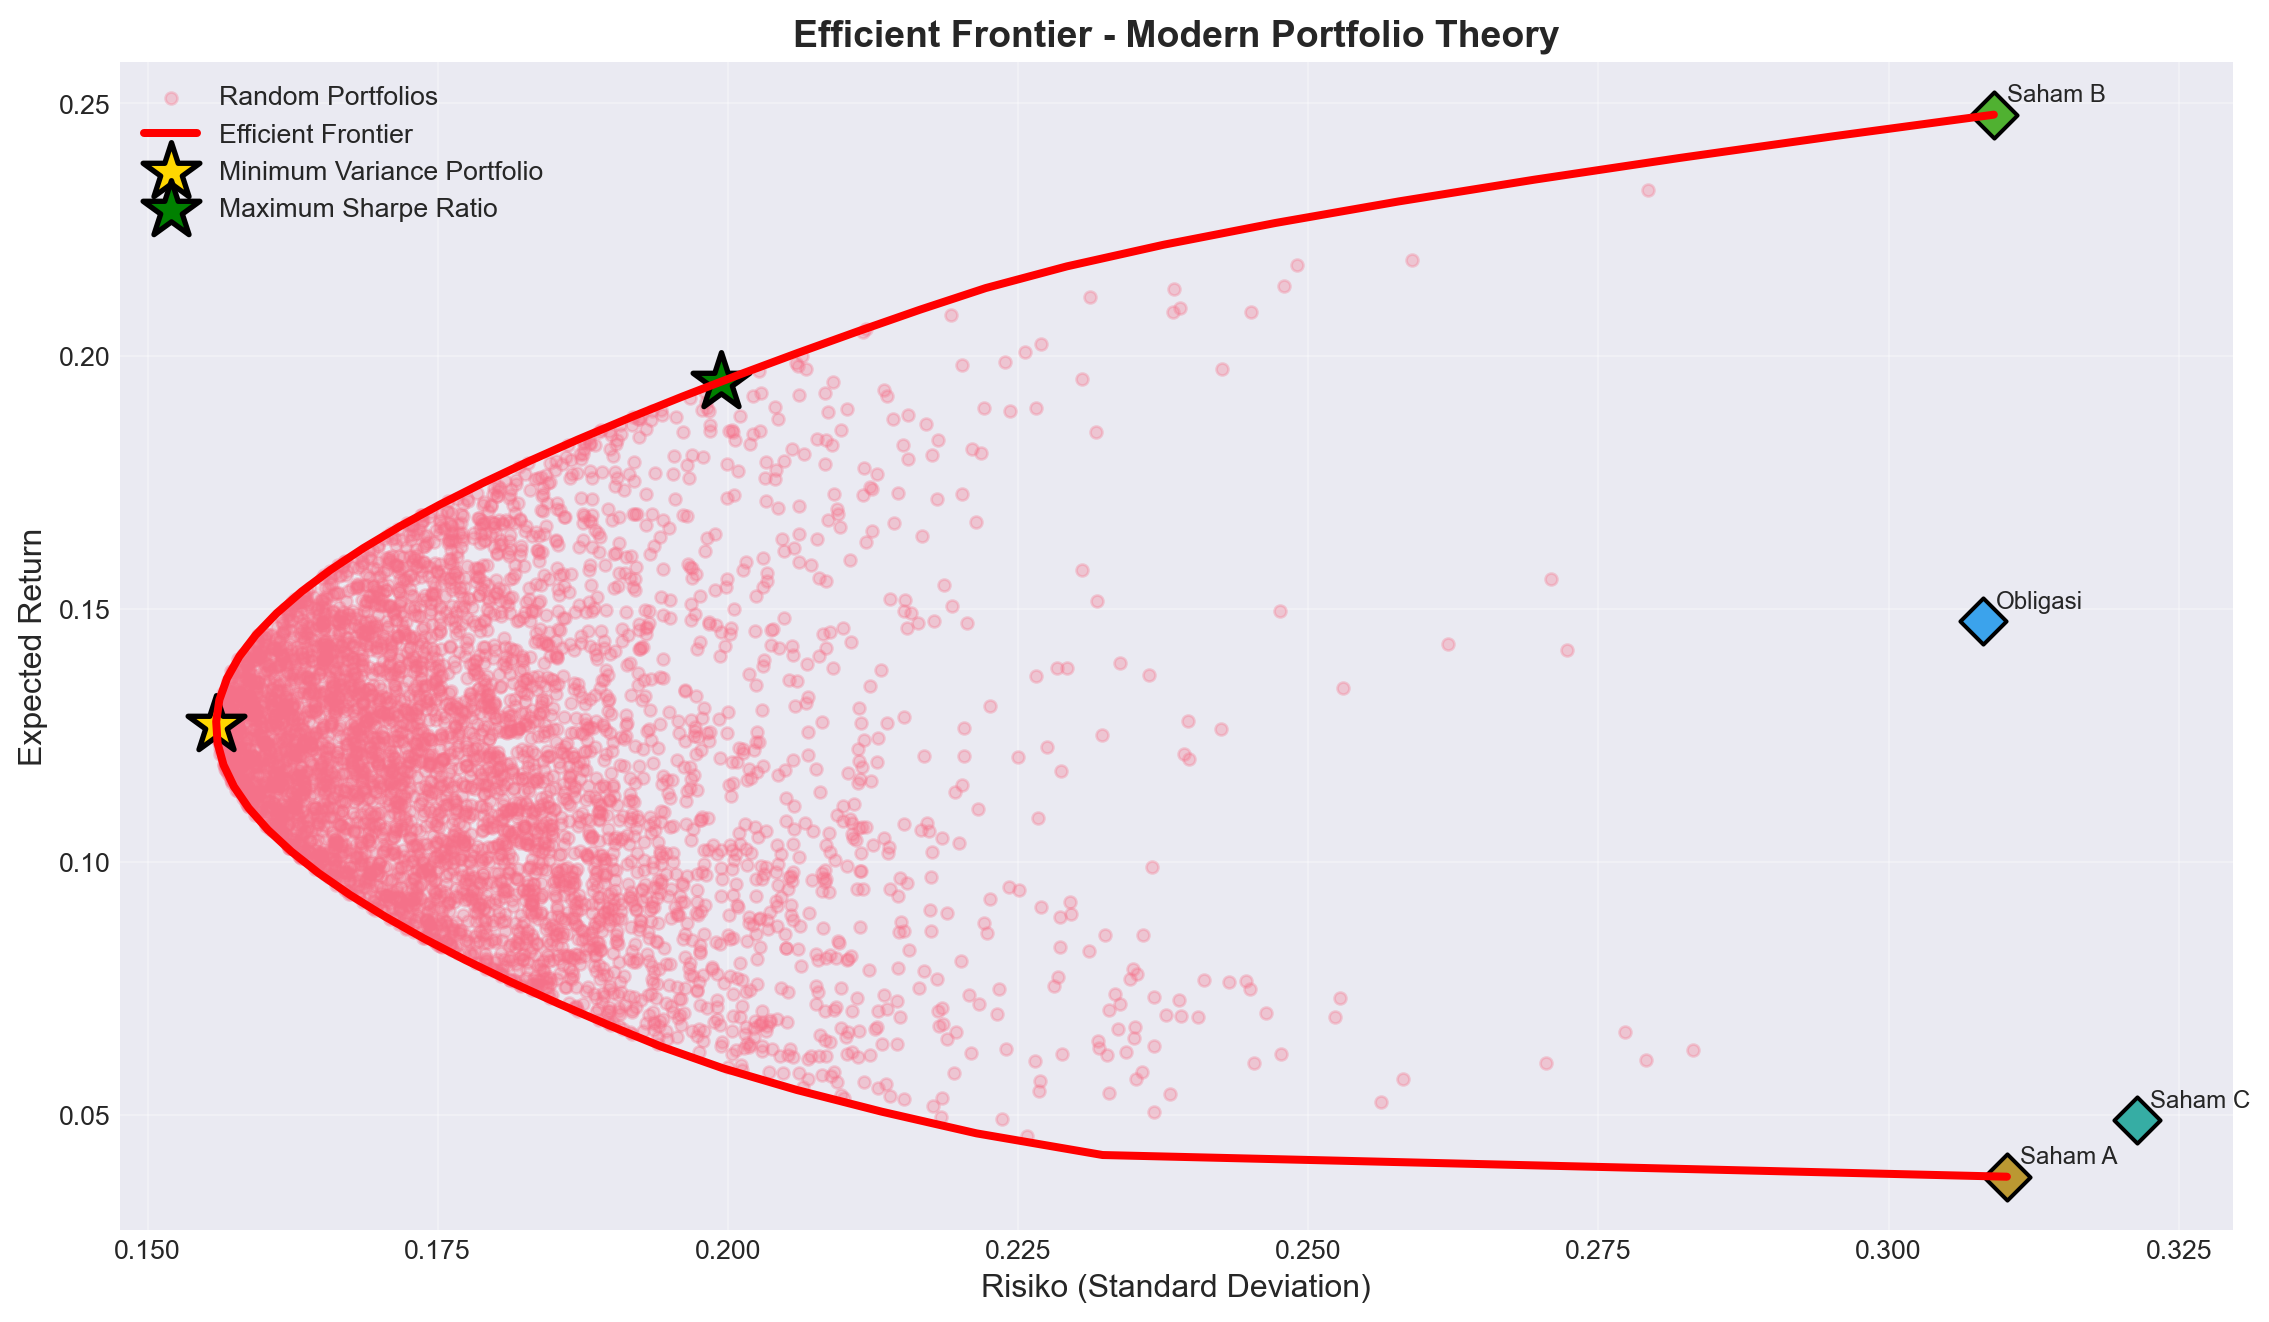
# Plot
plt.figure(figsize=(12, 7))
plt.scatter(random_stds, random_returns, alpha=0.3, s=20, label='Random Portfolios')
plt.plot(ef_stds, ef_returns, 'r-', linewidth=3, label='Efficient Frontier')
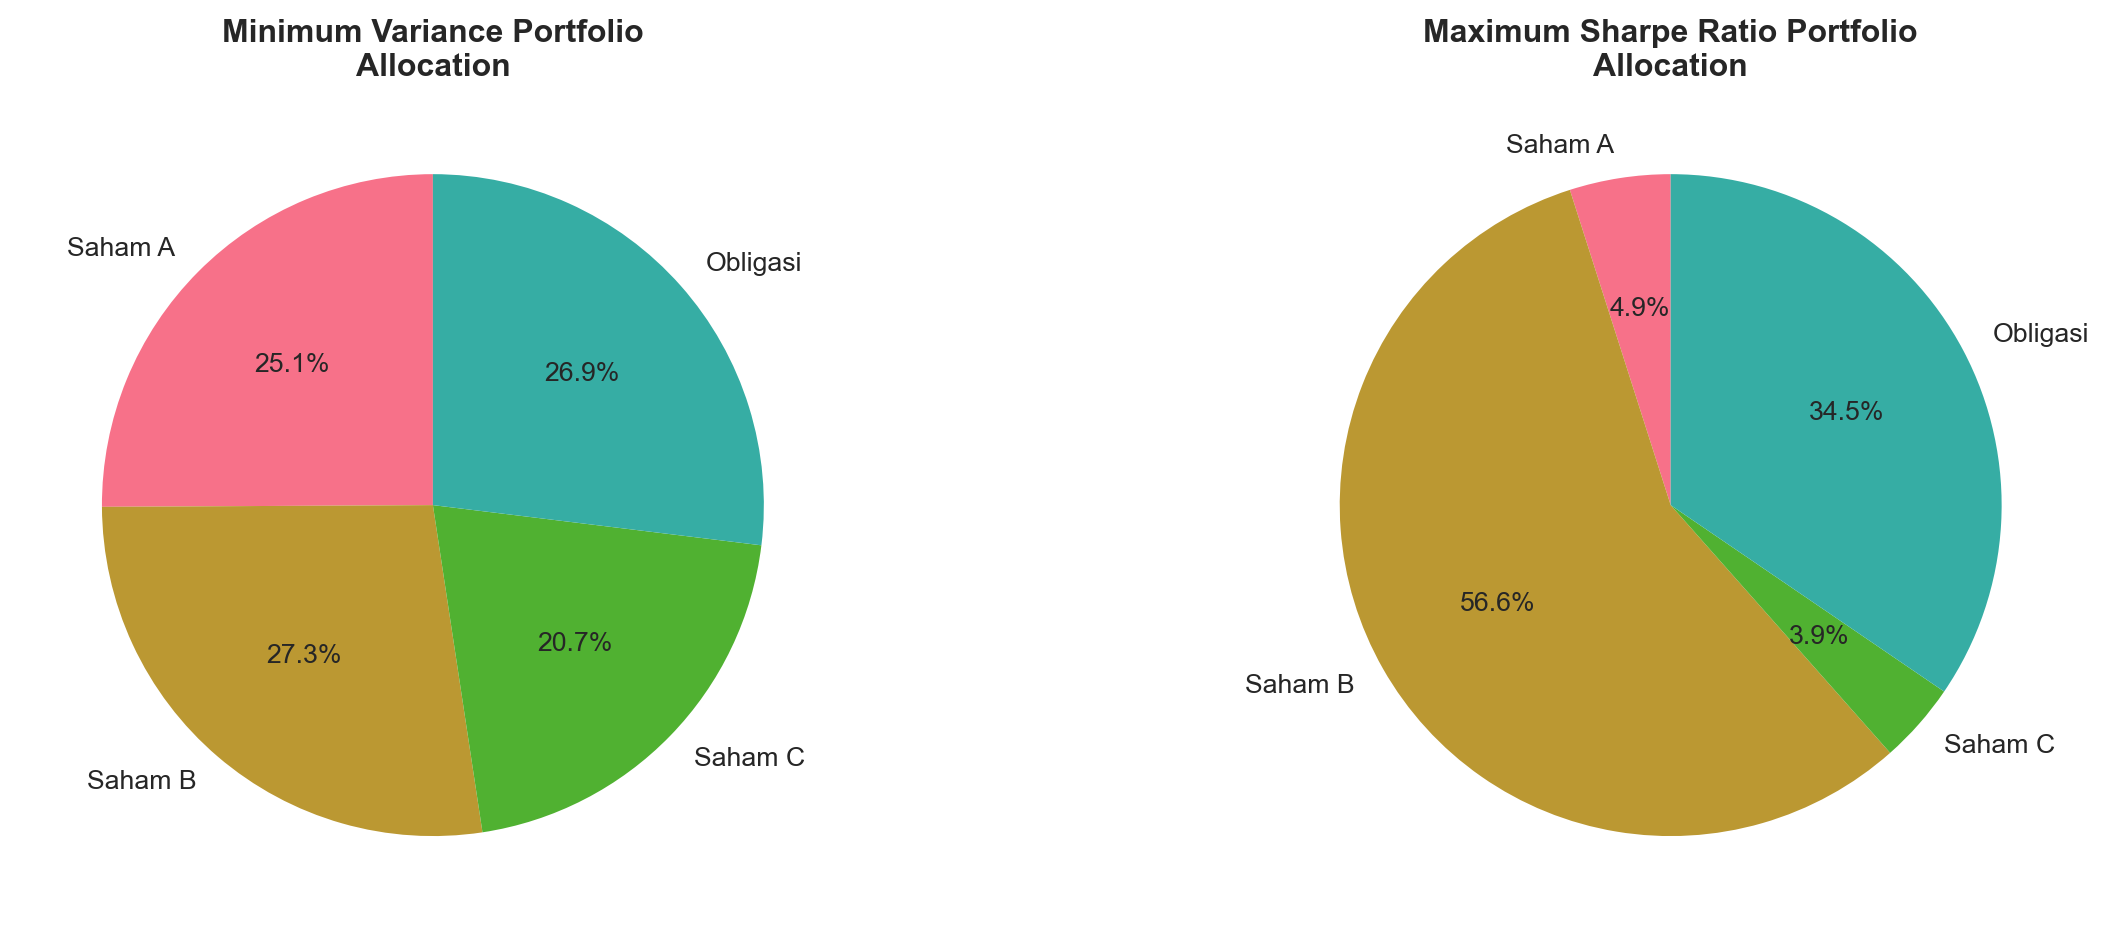
plt.scatter(mvp_std, mvp_return, marker='*', s=500, c='gold',
edgecolors='black', linewidths=2, label='Minimum Variance Portfolio')
plt.scatter(sharpe_std, sharpe_return, marker='*', s=500, c='green',
edgecolors='black', linewidths=2, label='Maximum Sharpe Ratio')
# Plot individual assets
for i, asset in enumerate(assets):
plt.scatter(np.sqrt(cov_matrix.iloc[i, i]), mean_returns[i],
marker='D', s=150, edgecolors='black', linewidths=1.5)
plt.annotate(asset, (np.sqrt(cov_matrix.iloc[i, i]), mean_returns[i]),
xytext=(5, 5), textcoords='offset points', fontsize=9)
plt.xlabel('Risiko (Standard Deviation)', fontsize=12)
plt.ylabel('Expected Return', fontsize=12)
plt.title('Efficient Frontier - Modern Portfolio Theory', fontsize=14, fontweight='bold')
plt.legend(loc='best', fontsize=10)
plt.grid(True, alpha=0.3)
plt.tight_layout()
plt.show()